Analyze, synthesize, visualize: about cards, links & graphs
This post extends “What is the point of a graph view?”, in which I discussed the usefulness of graphic representation when working with interrelated notesI switch from “notes” to “cards” later in the post, as I did in the previous one.
. I put forward the following ideas:
New note-taking tools have emerged in a context where the appearance of novelty takes precedence over tried-and-true documentation techniques, and they prioritize needs that have been shaped by several years of smartphone and search engine domination […]
Graphs show us what hypertext is, conceptually and practically, which influences the way we write and think about interrelation; and the more it taps into all the documentary work that we apply to cards, the more it becomes useful.
Given that the rise of new note-taking tools has little to do with hypertext and documentation, it’s a bit clearer why so many people wonder what the point of a graph view is.
Hendrik Erz, developer of Zettlr, took up the subject and wrote a post of his own, titled “Quo vadis, PKM?”, which I encourage you to read. In it, he develops two ideas. First, a critique of graphs :
“As humans we are used to detecting patterns, so whenever we look at a network, we immediately attempt to make sense of it. And that can lead to critical errors in judgment.”
And then, an alternative to graphs, focused on search and suggestions:
“We can have our computer search for connections between notes by looking at the words we use. This way, our computer can learn to identify synonyms on its own. By displaying this information in the appropriate places, our note taking tools can show us the network of our knowledge without either of us having to make any grave mistakes.”
I cannot comment on the technical aspects of this proposal—I don’t know enough about automatic language processing or machine learning. However, I am curious to see this feature in action. I think it would be useful. The idea of interrelation through keywords seems very relevant to me: this was the way Paul Otlet proceeded, proposing to index documents via the Universal Decimal Classification, and then to use indexing tables to suggest relationships between documents.
I need to address the first point, however, about interpreting graphs, because there is a risk of misunderstanding. And building from there, I have a few things more to say about cards, links and graphs.
A graph view is not a tool for analysis
I absolutely agree with Hendrik that trying to interpret graphs is risky. However, I never suggested we do that in the first place (in the context of note-taking). I wrote that graphs encourage us to look for patterns, but I was not referring to interpretative reading: I see these patterns simply as material for reflecting on the writing process, not the contents of the notes.
In my previous post, I gave two examples: a graph allows you to quickly identify isolated notes, which you probably want to link to other notes; it also allows you to detect aggregates of notes that have formed as you were writing and linking, and this encourages you to take a closer look (to assess the links, add some, remove some). Note that I’m not talking about discovering a hidden meaning, or the nature of the relationship between two ideas, but simply about visualization as an aid to making decisions about the writing process.
I think part of the problem lies in this expression: “note-taking”. It’s misleading. It suggests that what you do is capture things, extract information, and then organize it to make sense of it. But I actually have a completely different perspective. I don’t follow an extractive approach, whether purely manual or partly automated, and which would lead me to do content analysis, to try and interpret the meaning of a network. I follow a creative approach, and this means two very important things.
First, everything in my notes was created by me. Obviously, I gather a lot of information from external sources: notes about references contain excerpts that I copied from them; notes about concepts contain definitions I lifted from dictionaries and encyclopedias; notes about people contain real biographical information. But none of this is automatically harvested from either web pages, data warehouses, or authority files: I copy or write everything manually, with purpose.
The same thing goes for links. No relationship between two notes is created automatically. If I have two concept notes linked in a hierarchical way, for instance “Graph” and “Document graph”, it is because I wrote it that way, manually adding and qualifying the link as in a thesaurus (i.e. generic/specific). By the way, link types is a feature of our graph tool Cosma that very few other tools offer, implemented in a very simple way through writing, and which imitates the subject-predicate-object logic of the semantic Web:
This author wrote about [[id]] a concept.

The link to this other [[prefix:id]] concept
is qualified with a prefix.

A document graph is a specific form of
[[generic:id]] graph.
So I already know everything that’s in my notes: I don’t need to discover it, just re-discover it. I don’t need to parse some extraction from Wikidata or the VIAF: I just need to remember the things I’ve written, in order to write new ones. So it’s not a matter of interpretation but memory, and the tools to augment it—obligatory reference to Douglas EngelbartAugmenting Human Intellect, 1962.
but I’m also thinking about Howard Rheingold’s tools for thoughtTools for thought, 2000 [1985].
and Jack Goody’s study of writing as a technology of the intellect.The Domestication of the Savage Mind, 1977.
The second important thing I mean by creative approach is that the point of me taking notes is to create new things. This is where we move from “note-taking” as the capture of external information to “note-taking” as the making of your own ideas through writing. It starts with analysis: “the breaking up of a complex whole into its basic elements or constituent parts”.Source: Oxford English Dictionary.
I break down the general problem into its base concepts; the scientific literature into individual publications, and those into the ideas they contain. All of these become individual notes and then, synthesis begins: “the putting together of parts or elements so as to make up a complex whole”.Source: OED.
And how do I synthesize? Links.
To illustrate the role of links, and because some readers pointed out a lack of concrete examples in my previous post, I’d like to give you one.
I study knowledge organization, so I created a concept note about it. Within this topic, I focus on reticular organization, structures in the shape of networks, including hierarchical ones (trees); network, tree, two more concept notes.
When I read the first volume of Robert Estivals’ General theory of schematization, I encountered this powerful idea: human cognition proceeds in arborescent reduction followed by reticular organizationEstivals, Théorie générale de la schématisation 1, 2002, p. 35.
. I created a reference note about the book and copied the quote there. I also created a “Schematization” concept note and added quite a few links to other notes in both of these.
While reading my colleague Clément Borel’s PhD dissertation, I came across a list of metaphors used in knowledge organization: trees, forests and labyrinths, rivers, oceans and islands, unexplored territories and websBorel, Outils sémantiques au service du livre numérique, 2014, pp. 74–81.
. One more reference note, and I linked this one to both “Knowledge organization” and “Tree”.
Now for synthesis. One day, while chatting with colleagues about visualization, we observed that trees and networks are the most popular metaphors in knowledge organization, but we couldn’t reach a consensus on why this is so. When I got home, with the question still on my mind, I decided to put my notes to work. As I was browsing through connections, I got an idea. So I created an idea note (not a reference note, not a concept note)In French, my main note types are: concept (self-explanatory), lecture (a note about some publication) and… note. I use the latter for writing down my own thoughts.
describing the following idea: metaphors in knowledge organization reflect human cognition, which happens to be tree-like and network-like. Below, I reproduce the contents of the file, replacing only the [[identifiers]] with the symbol ⟡ for readability. Next is a screenshot of that note visualized with Cosma.
There are many metaphors to describe the ⟡ organization of knowledge: trees, forests and labyrinths, rivers, oceans and islands, unexplored territories, webs, and many other things [@borel2014, 74-81]. ⟡ Trees and ⟡ networks can be considered the most popular, which is no accident: in his theory of ⟡ schematization, Estivals showed that human cognition is based on a double movement of arborescent reduction and reticular organization [@estivals2002, 35].This also allows me to address something Hendrik wrote in the final thoughts of his post:
“New insights do not necessarily come about by interconnecting already existing thoughts. New insights come around because we do other things when we don’t write.”
As I described in the example above, I do get new insights when I don’t write. But giving them strength often means going back to writing. Also, the reason I have notes about people is to write things like this:
My ⟡ colleague told me that ⟡ concept A is essential for ⟡ topic B.Here, I use writing to multiply paths to information. I tend to recall exchanges just as well as readings. I’ll think “Oh, someone told me about this…” and go check the note I have about them in my files, browse the backlinks and retrieve the information. I agree with Hendrik that we don’t spend every minute of our lives writing and it’s exactly why we should integrate that in our knowledge work: document things that happen outside of writing; shape our note-taking practice in the way we get insights in general. It make notes much more organic to use.
I hope that this example will allow those who were puzzled by my previous post to better understand my perspective. My note-taking is academic; it builds on itself but also on things that happen outside of writing. It relies on the index card as an analytical tool (breaking things down) and on the link as a synthetic tool (composing new ideas). And I don’t use the graph as a tool for analysis or synthesis, but as a visualization tool, to augment my memory and reflect about the writing process.
The usefulness of graph views, illustrated
Situating my work and my perspective is essential here, because I don’t think I represent the majority of people who use interlinked note-taking tools. As I said, “note-taking” is misleading, but they’re also called “personal knowledge management” (PKM) tools, which is just as misleading, if not more so.
Indeed, PKM methods and tools are most often used to manage not knowledge but tasks. Looking at a popular PKM methodology such as Tiago Forte’s, for example, I find that it has little to do with the interrelated documentation techniques I described in the cases of Otlet, Luhmann and Matuschak. Forte’s PARA system (see screenshot)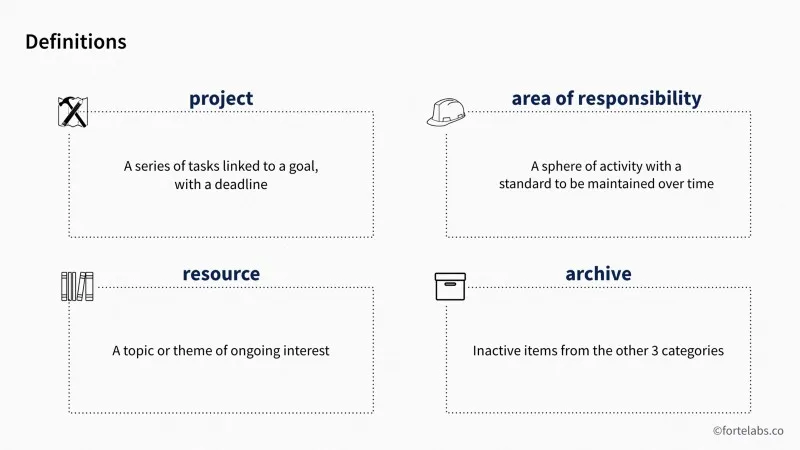 is a project management methodology. Sure, it can be translated into a set of folders inside a note-taking tool, but also into the columns of a kanban board. Sure, it can be used to organize practices such as mine—scholarly, analytical, synthetic and reticular. But it’s mostly used to structure “productivity” approaches (another ambiguous term…) such as daily notes, to-do lists and workflows—all of which do not necessarily require links.
And so the same note-taking tool can very well be used by people who systematically make links between notes and by others who don’t make links at all. Which brings us back to the subject of my previous post: what is the point of a graph view, and who is it useful to?
In my case, “productivity” means producing new ideas, and for that, interrelation is fundamental. I hope I have clarified this with my note example. I form new ideas by synthesis—you could say connection, assembling, combinationGordon Brander says composition.
—of different notes, different conceptual fragments. And the mechanism of synthesis is the link. So I put links everywhere.
As I said in my previous post, software interfaces are fundamental in enabling and supporting this practice. I realized recently that, more and more, my notes are made of little clusters of links—sentences or paragraphs containing several links in a row. Some of my idea notes, like the one I described earlier, consist of a single sentence or paragraph, full of links, in the manner of Andy Matuschak’s notes. I do this because some applications show links (and backlinks) in context, i.e. with the surrounding sentence or paragraph. Over time, I’ve come to rely more and more on contextualized backlinks as a way to remember the meaning of connections. And so it has changed the way I write my notes.
Another thing about links and interfaces: using links extensively makes a graph view much more useful. Now, this seems obvious to me, but here again I’ll use an example to clarify my point.
In my previous post, I criticized a trend which consists of publishing screenshots of your graph and raving about it, despite it making no sense at all out of context. Since then, I went back to look at some of these screenshots again. While I had been focusing on people who marvel at their graphs, this time I looked for people who criticize them. And when I looked at the images shared by these people, I found that they often had similar problems: either a complete lack of interrelation, or a half-baked visualization feature.
Here’s a look at Zettlr’s new graph view, shared by Hendrik Erz in the tweet that started it all:

Of course the graph view is useless here: there is almost no “graph”—in the sense of structure—to speak of, since there are almost no links between the notes. The “graph”—in the sense of visualization—does not help him reflect on the note-taking process and it does not help him navigate between notes either, and so its usefulness is almost non-existent.
Now a different example, Roam’s graph view, with this screenshot illustrating a post titled “The Fall of Roam” by Dan Shipper, in which the author strongly criticizes both the graph and the app surrounding it:

Here the problem is twofold. First, the author seems to take notes more for “productivity” than knowledge work: alongside book notes, he uses a daily diary, a to-do list and he takes meeting notes. Going on a hunch, I think the concentration of links on a very small subset of notes reflects this use. It’s obvious that the graph view does nothing for his approach, which is probably better served by classic features such as collapsible trees and tagging.
And secondly, the graph view is very limited. Laying the graph on a grid eliminates any regular or irregular pattern that could feed his reflection on the note-taking process. And nothing helps him differentiate between notes visually based on categorization, whether exclusive (folder-type) or inclusive (label-type). Is it so surprising then that he calls it “a very appealing looking garbage dump”?
I would like to offer a counterpoint to all this by sharing two screenshots of my own digital index cards. Switching from “note” to “card” allows me to emphasize the nature of my perspective, which is academic and rooted in document theory. Here they are, visualized with the tool my team created, Cosma:


In the captions, I highlight two aspects that make Cosma’s graph view useful. First, the graph and the cards are displayed side-by-side. I don’t think the graph view alone is a superior tool by any means, it’s much more useful when closely connected to the cardsYou can do this in Obsidian, which has fantastic window/pane management
. And secondly, the graph view leverages all my documentary work—categorizing cards and relationships, indexing with tags—through graphical features (color, strokes) and interactions (filtering, highlighting, focusing).
This post has gotten even longer than the previous one, so I think it’s time to conclude. I’ve described how the card, link, graph triad overlaps with the analyze, synthesize, visualize triad. I’ve insisted on the fact that visualization is not meant to produce self-contained meaning, but to help reflect on the writing process. The graph view’s usefulness is directly correlated with the role links play in you note-taking practice. It decreases as you move away from reticular writing to more traditional writing techniques (list, trees, tags), which are more emphasized in “productivity” approaches. Conversely, it increases if you combine both worlds. The graph view’s most important benefit is to show you the structure of the hypertext you’re creating. And if it leverages documentary work (categorization, indexing), it becomes a very powerful tool.
A few months ago, I shared a post from Andy Matuschak about the difficult progression of tools for thought. Andy argues that if this field is to create something truly revolutionary, it needs to produce generalizable insights and create a stage to discuss them. Currently, conversations are scattered and rarely mention research. But research work on tools for thought does exist. Part of why I’ve decided to write these posts, and I think it’s also the case with Hendrik’s reply, is that I wanted to draw attention to our unique perspective: we build tools, but we’re also academics, doing scientific research on interlinked note-taking tools.
In my case, I belong to a field called Information and communication sciences (sciences de l’information et de la communication, SIC). We’re the French cousins of Library and information science. What I’v written here on cards, links and graphs is shaped by what I’m learning through the literature in my field, especially documentology and knowledge organization. And so Cosma is not just a mix of hypertext and data visualization: it’s also shaped by our knowledge of Paul Otlet’s documentationTraité de documentation, 2015 [1934] ; for English translations of some of Otlet’s works, see Otlet and Rayward, International Organisation and Dissemination of Knowledge, 1990.
and other things, such as the academic tradition of the erudite index card.
This work has some purely scientific outcome. I’m currently writing my dissertation, in which I state that my cards combine the elements of a knowledge graph (modeling the relations between entities, possibly formalized via an ontology) and a document graph (hypertext formed by documents or fragments of documents). I’m slowly building up concepts and observations to support hypotheses in relation to a scientific question. But scientific writing can take other forms, blogging for instance. We’re likely to be read by other audiences that way, and that is a good thing for research.
So, with this post coming to an end, I thank you for reading and I hope the discussion continues, here and within other spaces.